
Custom Indicator Coding
I specialize in creating custom indicators specifically tailored to your unique trading strategies on platforms like TradingView. My custom indicators are designed to help you make more informed decisions, providing you with a competitive edge in the market. Whether you’re a seasoned trader or just starting, these indicators will enhance your trading performance. Contact Me
Excel Spreadsheet Projects
I design and develop advanced Excel spreadsheets to meet the specific needs of traders like you. My services include creating backtesting tools, risk management calculators, and other custom Excel solutions that help streamline your trading activities. These tools are tailored to your individual requirements, ensuring you have the necessary resources to achieve success. Contact Me
Exclusive TradingView Indicators
Gain access to exclusive, private TradingView indicators that I’ve developed to provide deep insights into market trends and trading opportunities. These indicators are crafted to give you an advantage by revealing market patterns that standard tools might miss. By using my custom TradingView indicators, you can refine your strategies and improve your trading outcomes. Contact Me
Private Indicator Subscription Package
My Private Indicator Subscription Package includes two powerful TradingView indicators that are designed to give you an edge in the market:
Bias Master Pro

The Bias Master Pro is a private indicator that uses custom algorithmic logic to calculate the probability of the likely direction of the current open candle for each chosen time frame (up to 6 at a time). This allows you to trade with the trend and achieve better timings for your entries, increasing the probability of successful trades.
Enhanced Risk Management Calculator
The Enhanced Risk Management Calculator allows you to plan your trades in advance with multiple risk management options and profit-taking options. It includes custom RR multiple options, manual price targets, and stop loss/take profit targets based on ATR. This indicator also features a customizable table displaying all selected data, including price targets, dollar values, trade direction, risk amount, and more. You can easily modify your entry and stop loss position by clicking and dragging on the chart. It automatically calculates your lot size based on your account size.
These indicators are available as part of my exclusive subscription package, giving you access to advanced tools that can significantly enhance your trading strategy. Contact Me to learn more and subscribe.
TradersTavern PNL Tracker and Calculators
I created a comprehensive PNL Tracker that includes advanced calculators to simplify and optimize your trading experience for both futures and forex contracts or lots. This project is designed for ease of use, allowing you to calculate everything by simply selecting your trading type, contract or lot size, and stop loss.
PNL Tracker
The TradersTavern PNL Tracker provides performance metrics to help you monitor and analyze your trading activities. Key features include:
- Principal Amount: The initial amount invested.
- Daily Profit Target Percentage: The percentage of profit aimed to achieve daily.
- Start Date: The beginning date of the tracking period.
- Target Days: The number of days to achieve the profit target.
- Daily Risk Limit Percentage: The maximum percentage of the account balance that can be risked daily.
- Profit Target Goal: The financial goal to be achieved.
- Risk/Reward Ratio: A metric indicating the balance between risk and reward.
- Percentage of Loss Days: The percentage of days when a loss was encountered.
- Average Loss: The average amount lost during loss days.
- Longest Loss Streak: The longest consecutive days of losses.
- Loss Count: The total number of days with losses.
- Standard Deviation of PNL: Indicates the volatility of profit and loss.
- Cumulative Profit: The total profit accumulated over the period.
- Projected Profit Target Date: The estimated date when the profit target will be achieved.
- Percentage Return: The percentage return on investment.
- Maximum Drawdown: The maximum loss from a peak to a trough.
- Average Win: The average profit gained on winning days.
- Longest Win Streak: The longest consecutive days of wins.
- Win Count: The total number of days with profits.
Calculators
The included calculators are designed to simplify your trading decisions:
- Position Size Calculator: Helps to calculate the appropriate position size based on the account balance, profit target, and risk percentage.
- Ticks Required For Profit Target Calculator: Assists in determining the number of ticks required to achieve the profit target.
These tools are designed to provide you with all the necessary data to make informed trading decisions and manage your risk effectively. Contact Me to learn more about how this PNL Tracker can help you optimize your trading.
FOREX Daily High-Low Analysis Visuals
Unlock the Power of Data-Driven Trading Decisions with my comprehensive FOREX Daily High-Low Analysis Visuals project. This tool is designed to empower traders with actionable insights by analyzing key market data.
Original Data
This sheet forms the foundation by capturing raw market data, including hourly high and low prices.
- Date & Time: Precise timestamps of each market observation.
- High & Low Prices: Recorded high and low prices for each hour.
- Datetime Integration: Combined date and time for streamlined analysis.
Daily Summary
Provides a summarized view of daily market activity, highlighting significant trading hours.
- High Hour & Low Hour: The specific hours during which the highest and lowest prices occurred each day.
- Frequency Analysis: Tracks how often these critical trading hours repeat, offering patterns for better trading strategies.
High Hour Frequency
Zeroes in on the hour of the day with the highest frequency of hitting the day’s high.
- High Hour: Identifies the hour most likely to experience the highest price point.
- Frequency Count: The number of occurrences where this hour had the highest price.
Low Hour Frequency
Identifies the hour most likely to register the day’s low, providing insight into potential entry points.
- Low Hour: Highlights the hour with the most frequent low prices.
- Frequency Count: The total occurrences of lows during this hour.
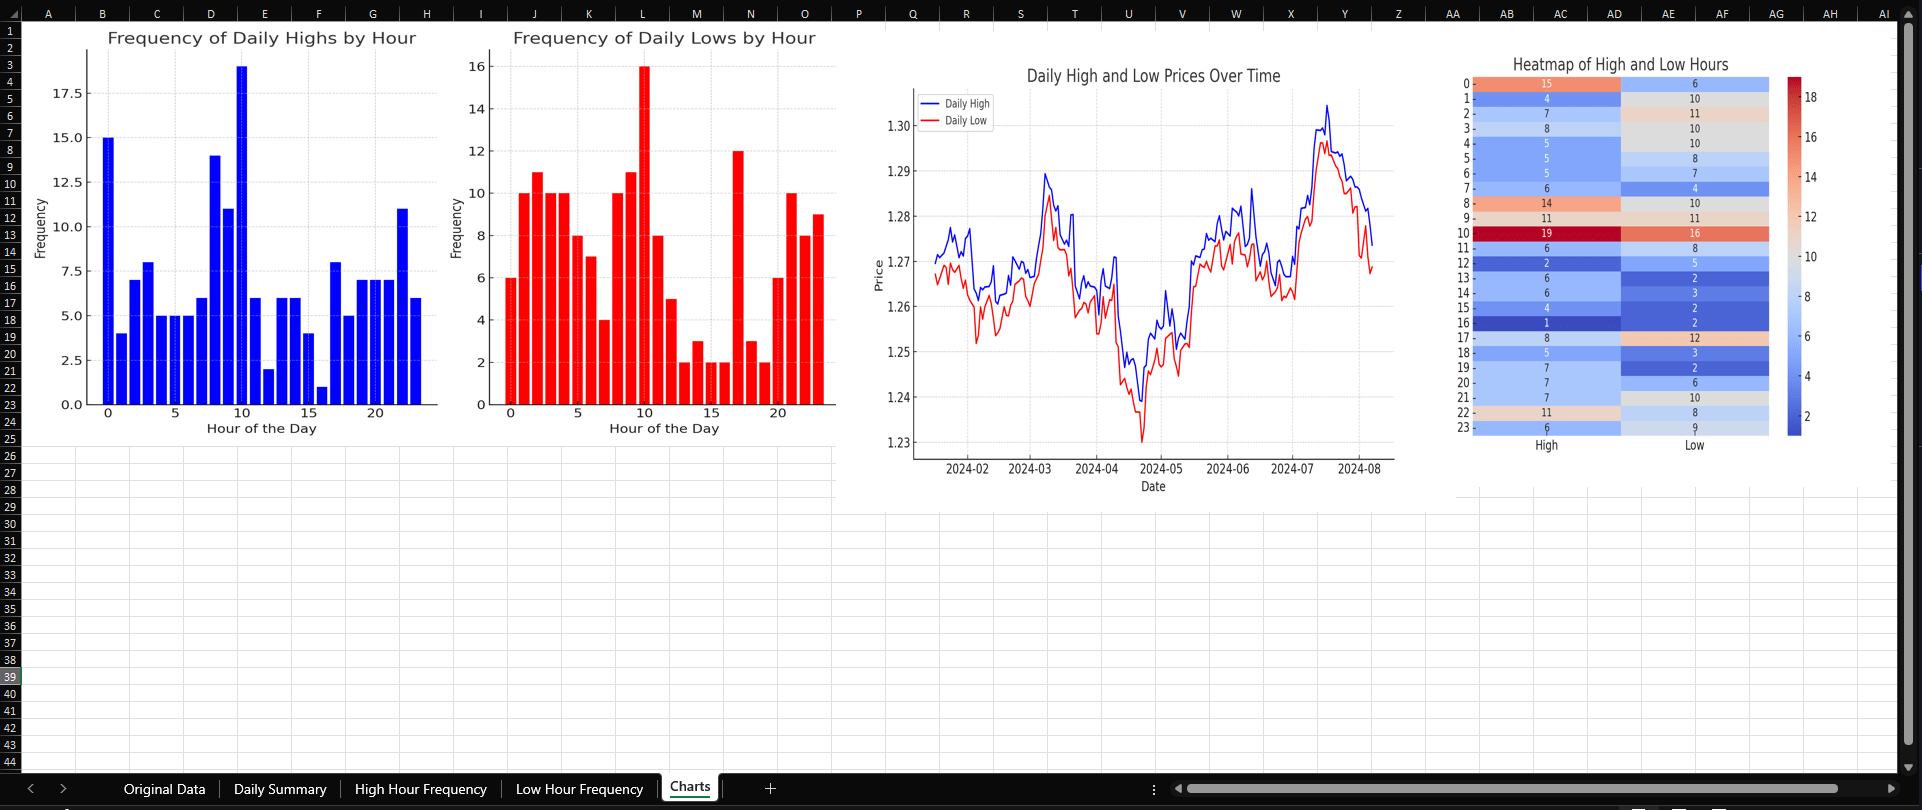
Charts
Reserved for visual representations of the data, offering traders a clear and immediate understanding of market patterns.
- Custom Visuals: The sheet is set up to incorporate charts, making it easier to visualize high and low frequency data over time.
With this detailed analysis tool, you can identify patterns, optimize entry & exit points, and enhance your trading strategy by integrating data-driven insights. Contact Me to learn more about how this analysis tool can give you a competitive edge.